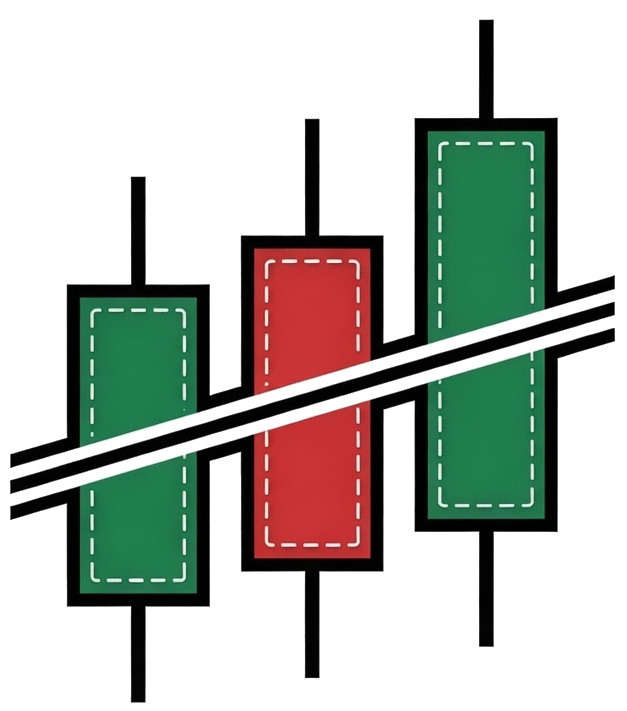

Heikin Ashi candles can make a backtest look cleaner than the market was
Synthetic candles are useful visually, but strategy fills and signal timing need to respect the prices that could actually trade.
Heikin Ashi charts are popular because they smooth the visual story. Trends look cleaner, noise is reduced, and discretionary reading can become easier. That same smoothness is exactly why they are dangerous in backtests. The candle values are synthetic. They are derived from price, but they are not the same thing as the market’s actual open, high, low, and close.
This is worth writing down because a Heikin Ashi strategy can look persuasive before anyone asks whether the fills were possible. A synthetic candle may show an OHLC value that was never available as a tradable price in the way the strategy report implies.
Why this catches people
The version I see most often is to treat a synthetic chart as only a visual skin. If the strategy is calculated on the synthetic chart values, the signals and fills can be based on those synthetic values. That can make entries look smoother, exits look more orderly, and drawdowns look different from what a standard-price chart would produce.
This does not mean Heikin Ashi is useless. It means the claim has to be honest. A Heikin Ashi overlay can be a good way to read trend structure. A Heikin Ashi condition can be a useful filter. But a backtest that fills on synthetic prices is not the same as a backtest that fills on standard market OHLC.
The Pine bit
The detail that matters is whether the script is using synthetic chart prices, standard ticker prices, or a mix of both. If the chart itself is Heikin Ashi and the strategy reads open, high, low, and close, those values may be Heikin Ashi values. If the script requests a standard ticker explicitly, it can compare the synthetic signal with standard prices, but then the code has to keep the two contexts separate.
A clean pattern is to treat Heikin Ashi as a signal source and standard OHLC as the price source for risk and execution assumptions. Even then, the author should explain what is being tested.
//@version=6
strategy("HA signal, standard close", overlay = true)

standardClose = request.security(ticker.standard(syminfo.tickerid), timeframe.period, close)
haTrend = close > open

if haTrend and barstate.isconfirmed
    strategy.entry("L", strategy.long)

plot(standardClose)
Why it can survive a quick review
This can slip through review because the chart is attractive. The smoother candle sequence can make the strategy feel more disciplined. Bad entries appear filtered out. Exits appear less noisy. The problem is that the visual improvement may come from using transformed data, not from a tradable edge.
There is also a communication problem. Many users hear “non-repainting” and assume that means “tradable.” A Heikin Ashi signal can be stable and still be based on synthetic prices. Stability and tradability are different claims.
How I handle it in builds
When I build with Heikin Ashi, I try to state the role it plays. If it is a visual trend filter, I keep it as a filter. If it is part of a strategy, I test standard-price behaviour separately and avoid presenting the synthetic result as a normal market backtest.
I check whether the user’s platform settings have changed the fill assumptions. TradingView has added options over time around using standard OHLC for fills on synthetic charts, but relying on a setting without explaining the data context is still weak design. The script should make the context obvious.
Where this shows up
The field test is straightforward: run the same signal idea on a standard chart and on the Heikin Ashi chart, then compare both the markers and the fill prices. If the signal only works when the synthetic prices are used for both signal and execution, the script may still be interesting, but the claim must change. It is no longer a normal price-action backtest.
I check whether the strategy depends on smooth opens. Heikin Ashi open values are derived from prior Heikin Ashi values, so they can create a cleaner-looking path. That is useful visually, but dangerous if the report treats those values as ordinary order prices. The script author has to decide whether Heikin Ashi is a filter, a signal source, or the actual tested price context.
Those roles should not be blended casually. The chart will look better than the explanation if the code does not keep them separate.
For client-facing work, the safest layout is often a dual-context display. Show the Heikin Ashi trend state, but also show the standard price level used for risk. That makes it harder for the user to confuse a smoothed signal with an executable price.
I check whether the user is asking for alerts or strategy results. Alerts from a Heikin Ashi condition can be useful if they are described as Heikin Ashi condition alerts. Strategy results carry a stronger performance claim. The same condition can be acceptable in one role and misleading in the other. That distinction should be made before the tool is presented as a system.
How I test it
I test synthetic-chart logic against a standard chart. The question is not whether the synthetic chart is useful. The question is which values the script is reading and which values the report or alert is claiming. A standard-chart comparison makes that boundary visible.
When synthetic charts are involved, I keep the standard-price comparison visible during development. It prevents the script from quietly drifting into a synthetic-only claim. If the synthetic view is only a filter, the standard context should still be easy to inspect.
The final check is whether the user could place the trade at the price the report implies. If that sentence is hard to defend, the Heikin Ashi result should be treated as analysis, not execution proof.
Checks before I trust it
- Identify whether conditions are reading synthetic or standard OHLC values.
- Do not assume a stable Heikin Ashi signal is automatically tradable.
- Separate signal source from execution price assumptions where possible.
- Compare the same logic on a standard chart before trusting the report.
- Explain synthetic-chart limitations when a user will read performance numbers.
The useful rule is that Heikin Ashi is a lens. A lens can be useful, but a backtest should not quietly pretend the lens was the market.